Visualizing the elements
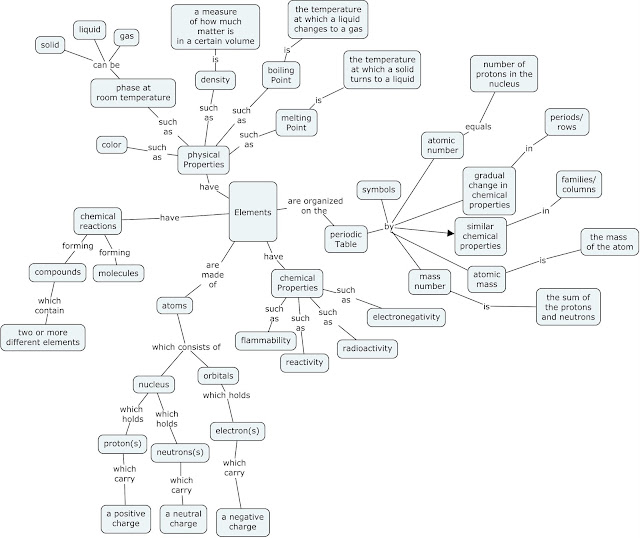
 I chose to create an infographic as a visual learning tool
to help teach some of the basic ideas of chemical elements. The topic of
elements is not a simple concept for all students to grasp. Telling a student that
all matter is created by basic elements is an abstract idea for students. This can cause confusion by what an “element” is. An example of a possible misconception would
be for a student to think- well, my desk is made of wood therefore wood is an
element. By utilizing simple pictures of atomic structure and showing that each
element is made up of its own atoms, the students will begin to understand that
atoms are not visible.
I chose to create an infographic as a visual learning tool
to help teach some of the basic ideas of chemical elements. The topic of
elements is not a simple concept for all students to grasp. Telling a student that
all matter is created by basic elements is an abstract idea for students. This can cause confusion by what an “element” is. An example of a possible misconception would
be for a student to think- well, my desk is made of wood therefore wood is an
element. By utilizing simple pictures of atomic structure and showing that each
element is made up of its own atoms, the students will begin to understand that
atoms are not visible.
I put a lot of thought into how I wanted the infographic to appear. I decided to use brighter colors and a “comic”
or “graphic” feel to appeal to my young student audience. I used bright
colors to attract attention to the alphabetic text on the page so the eye wouldn’t
only scan the images. Graphic novels are currently very popular with students.
Considering most of my students will be familiar with this style, I thought
they could relate and connect my infographic with graphic texts they may have previously
encountered. I selected the website Piktochart.com based on some of the examples from other previous MACSTEP students. I took
great care in selecting my images. It was important to me that the images tie
in closely with the content yet be simple enough for my students to understand.
I did deepen my understanding of the history of atomic structure through my
creation of my infographic. In my chemistry classes, I memorized some of the historical
scientists’ names and contributions. However, by paraphrasing what these
researchers accomplished into comic form, it deepened my understanding and recall.

Loading...

It is hart to believe than even ice cream is made out different chemical elements, but I know it is true. Nice visualization Mandy.
ReplyDeleteThank you, Humberto!
Delete